Inclass exercises, Day VII
Follow this link for day 7 materials and notes
Solutions for these exercises are available here
Sign Test
Weddell seals live in the Antarctic and feed on fish during long, deep dives in freezing water. The seals benefit from these feeding dives, but the food they gain comes at a metabolic cost as the dives are highly strenuous.
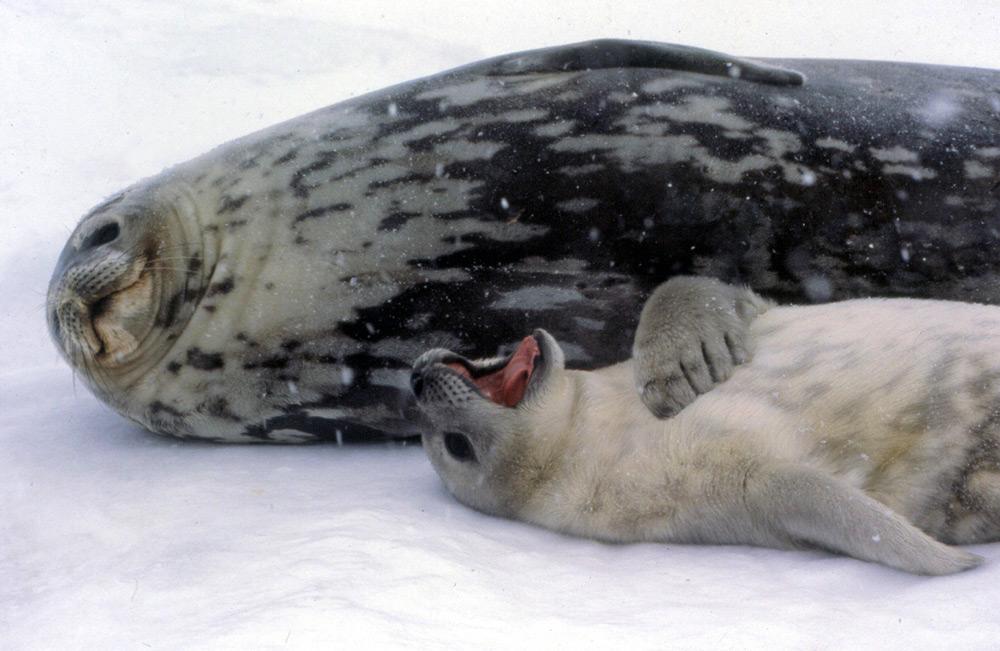
A set of researchers wanted to know whether these feeding long dives incurred an energetic expense, beyond the exertion a seal would experience while diving but not feeding. Researchers measured the oxygen use of seals as they surfaced for air after a dive. For 10 seals, they measured oxygen use (in ) of 1 feeding dive and 1 non-feeding dive. Download the data here.
Does feeding increase the metabolic costs of a dive?
Take the following steps:
- Examine the data, i.e. look at it!
- Understand why the sign test is appropriate here
- State the null, alternative hypotheses
- Conduct the test
- Report results, conclusions
Wilcoxon signed-rank test
Re-analyze the seal data above using a two-tailed Wilcoxon signed-rank test.
Take the following steps:
- State the null, alternative hypotheses
- Conduct the test
- Report results, conclusions
- Understand any differences in outcome between tests
Mann Whitney U test
Sockeye salmon swim hundreds of miles from the Pacific Ocean, where they grow up, to rivers for spawning. Kokanee salmon, by contrast, are a type of freshwater sockeye that spend their entire lives in lakes before swimming upriver to mate. In both types of fish, the males are bright red during mating. This red coloration is caused by carotenoid pigments, which the fish cannot synthesize but sequester from their food. The ocean environment is much richer in carotenoids than the lake environment, which raises the question of how the kokanee males are as red as the sockeye when the kokanee do not live in the ocean.
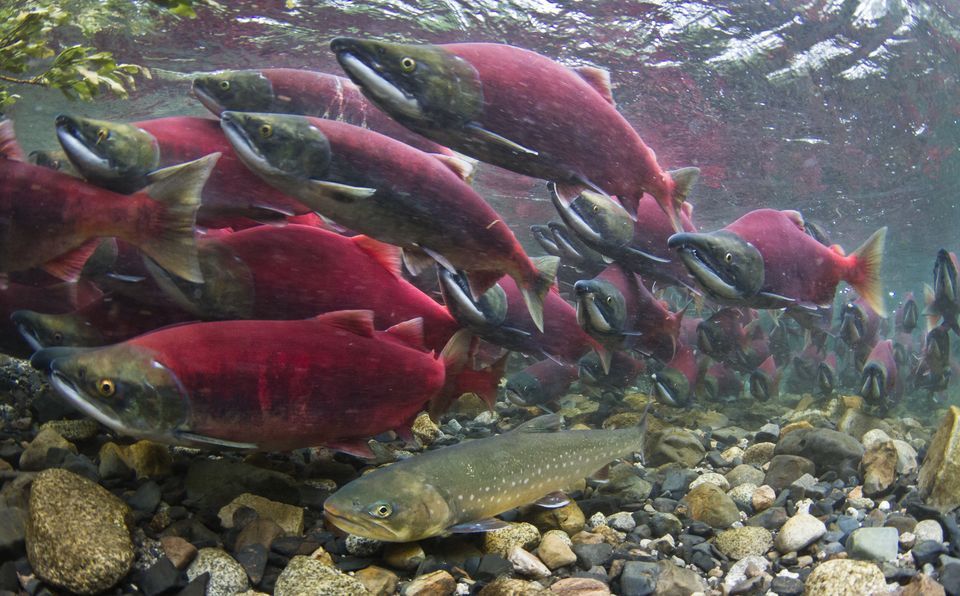
Researchers hypothesized that kokanee might be more efficient at using available carotenoids than the sockeye. They tested this hypothesis in an experiment where both sockeye and kokanee individuals were raised in the lab with low levels of carotenoids in their diets (Craig and Foote 2001). Their skin color was measured electronically. Download the data here.
Do sockeye and kockanee tend to have different skin colors in this experiement?
Take the following steps:
- Read in and examine the data
- Understand why the Mann Whitney U test is appropriate here (but a two-sample t-test might not be)
- State the null, alternative hypotheses
- Conduct the test
- Report results, conclusions
Tidying data with tidyr
-
The dataset pew.csv reports results from a Pew poll on world religions, where it asked individuals with which religion (if any) they affiliate. Results were tabulated based on income levels. Use tidyr to tidy up this dataset.
-
As it turns out, some results from the poll were missing but later recovered! They are found in pew2.csv. Make this dataset tidy, and then create a single dataset that combines
pew.csvandpew2.csvinto a single tidy dataframe. -
Using the final data frame, make a faceted histogram of incomes across religions.